|
Compare |
  
|
|
Compare |
|
Menu: Image -> Compare
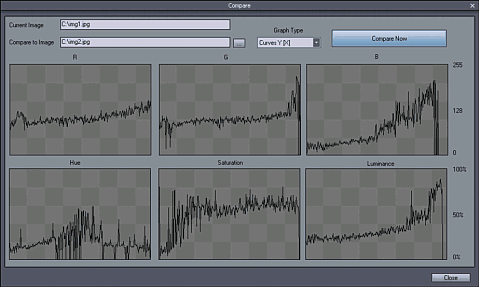
Compare the current image with image from disk. Both images must have the same dimensions. The graphs will show the dependence of the two images and can be used to evaluate what changes were made to the image using various processes.
It is also a great tool if we want to repeat an unknown (but simple) process. By comparing our result with the result from the unknown process we can see how close we are getting and what tools we should use.
When the Graph type is Curves XY, then images are equal when the graphs go close to diagonal lines. When used Diff graphs the match determine a graph close to a horizontal line.
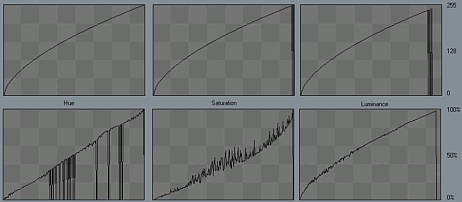
Example: Comparing original image (Compare to Image) with processed (Current Image) we can see by the curve characteristic that mostly gamma has been changed and nothing else because the graph in RGB are each similar and have a gamma characteristic.Hue is linear that means the image has the same colors (no color changing process has been used)
We can ignore the noise or drops in the graphs as they indicate that not enough data are at the gradient levels. What is important is the direction and shape of the curve.
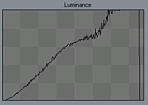
In the next example the Luminance graphs is a tell-tale signal that multiple processed were used where Levels were with clamping the highlights were one of them. (The graph doesn't end in the corner where it should, but earlier). Other processes changed the linearity (gamma had been changed)