|
Levels/Histogram |
  
|
|
Levels/Histogram |
|
Levels
Menu: Adjust -> Levels...
The Levels dialog displays Histogram, Tone Curves and allows you to change the level values.
Histogram
The Histogram (graph on the left) displays the tonal distribution of the image. It displays values based on their level of brightness, on the x axis from dark (0) to light (255). The y axis represents the total number of pixels in the image with that level of brightness. You can see the Histogram for all RGB image parts or for R, G, or B separately. You can see only the intensity histogram also. (Which merges the RGB to one graph)
The Tone Curve (graph on right) represents the mapping of input tones to output tones. The default curve is a linear upward line. It represents the relationship between the image before and after correction. On the x axis are the levels from 0 to 255 of the image before correction, on the y axis are levels after correction. Obviously if the curve is linear from bottom left to top right (as on the image above) there are no changes - the input levels are mapped 1:1 to output levels.
What Histogram shows
Histogram can tell you many things about the image, about the processing already done on the image and also about the originating device (digital camera, scanner ...etc). First look at the x axis. This represents the dynamic range 0-255 (dark-light). The wider the histogram , the greater the dynamic range and that means an image with better contrast as well.
|
|
Dull Image - Narrow histogram - small dynamic range means low contrast and flat image |
|
|
Normal Image- Wide histogram, great dynamic range also means good contrast |
Low Key: If the histogram has the peaks concentrated along the left side of the graph, we call this a "low key" image. Depending on the image it can also mean an underexposed image.
High Key: If the peaks are concentrated on the right side, the image is called "high key". This could mean an overexposed or too bright of an image. Note: most of the digital cameras underexpose, you will have more pictures with low key than high key.
Tone jumps: If the histogram has empty spaces in intervals, this means a lack of smooth gradation. This usually tells you that the image was already processed. (It was stretched to full dynamic range, or there was a color reduction, gamma correction or other adjustments applied.)
|
|
|
Normal Image- The histogram is mostly uniform, the image covers most of the dynamic range. |
|
|
|
Low key-Most of the colors are in dark |
|
|
|
High Key-Most of the colors are in the brights. |
|
|
|
Tone Jumps-The detailed histogram shows that the image brightness was already stretched, there are Tone Jumps in regular intervals. |
There are many other things that a histogram can tell you - you will learn the art of it as you work with many images.
Adjusting Levels
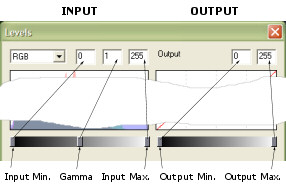
There are 2 sets of controls: Input and Output. The Input control has Min, Max and Gamma, where the output Control has only Min and Max. You can either type numbers directly or move the handles on the multiple slider control.
How it works:
You are mapping the brightness of RGB channels (or any channel separate) from input to output. As you move the sliders, the Tone Curve graph changes as well. You can change values on the RGB together, or you can choose any channel separately to change its levels. After you change channel R for example you can select channel B and make additional changes.
The Input Min slider adjusts the shadow areas: moving it to right - shadows become darker.
The Input Max slider adjusts highlights: Sliding it to the left - light areas become lighter.
The Output Min adjusts the dark areas: Moving it to the right - dark areas become lighter.
The Output Max adjusts the light areas: Sliding it to the left - light areas become darker.
The Input Gamma value changes the linearity of the Tone Curve.
Example of using Levels
|
|
The image is Low Key, that means most of the colors are in dark areas.Almost half of the range is not used (there are almost no pixels after the first half of the histogram) |
The sharp peaks at the very right part of the histogram shows that a large number of highlights are blown out. We can cut them out as well. |
|
Now we select Blue channel only and move the Gamma to 1.1 |
|
|
|
|
We selected the range of Input where the majority of pixels are. This stretches the histogram to full range. The image is no longer in Low Key |
Selecting different Input Min and Max will stretch the image to the output values 0-255, making the image full range. |
|
We moved the sliders on the Input Min to 15 and Max to 165. The Tone curve shows the mapping Input/Output. |
|
|
|
|
Adjusting gamma changes the linearity of Input/Output. In our case, dark colors are mapped into brighter values, making the midtones brighter. |
We still don't see much midtone, so adjusting gamma (>1.0) will make the midtones appear brighter. It also flattens the high contrast a little that was created by stretching. |
|
Now we change the gamma to 1.8 This changes the Tone curve to non linear |
|
|
|
|
We don't like the blue cast the image has, so we put gamma of Blue channel a bit back - make it almost linear again. This pushes the Blue back to dark tones and shows more realistic colors. |
See the result histogram below. The image is no longer in Low key. The pixels cover the whole dynamic range. |
|
We change the gamma of Blue Channel |
|
|
Result:
The image is no longer in Low key. The pixels cover the whole dynamic range.
With Levels you can fix many of the color and range problems your images have.You can try to adjust various levels and see what effect it has on an image. Look at the Tone Curve also and try to understand it's relation with the histogram.
Pick Up Shadows and Highlights
With the two buttons on the bottom right of the dialog box you can pick up shadows and highlights from the image. With these tools you can adjust areas on image that you want to have black and other areas that you want white.
![]()
Shadows: Click on the Pick Shadows button (the left one), cursor will change to an eye-dropper. With this tool you can click on the part of the image where you want to have black. The curves of the R, G and B channel will adjust in such a way that the color you point at will become black.
Highlights: Click on the Pick Highlights button (the right one), the cursor will change to an eye-dropper. With this tool you can click on the part of the image where you want to have white. The curves of the R, G and B channel will adjust in such a way that the color you point at will become white. All the other colors and tones will adjust as well.
Note: The Pick up tool will not only let you to pick a color from the image, but from anywhere of the screen as well (for example from the Color & Texture Palette).